See the garden in January, and in ten years
Most planting plans show one moment: the day of install or an idealized maturity. OpenLandscape3D adds two sliders — month and years after planting — and redraws the whole design from plant data and your frost dates.
Growth you can check
Plant size follows a simple, published curve so the web and iOS apps always agree: size approaches the mature midpoint from the install size at a rate set by the plant’s growth class.
s(t) = sm − (sm − s0) · e^(−k·t), with k = 0.12 for slow, 0.25 for medium and 0.45 for fast growers, applied separately to height and spread. It is a planning model — pruning, soil, water and competition will change real results — but it makes the trade-off between install size and patience visible.
Seasons from your frost dates
- Deciduous plants are leafless after your first-fall-frost month and before your last-spring-frost month.
- Fall colour shows in the first-frost month and the month before it.
- Flowers appear in each plant’s bloom months.
- Herbaceous perennials die back over winter; grasses stand in straw colour.
Why it matters
Seeing year 10 is how you catch a tree that will shade out the vegetable bed, a hedge planted too close to the fence, or a border that is all June and no September. The bloom calendar and spacing visualizer use the same rules.
One design, four seasons, ten years after planting.
Available now
- Month and years-after-planting sliders
- Growth curve by growth class
- Leaf-off, fall colour and bloom by month
- Existing plants start from measured size
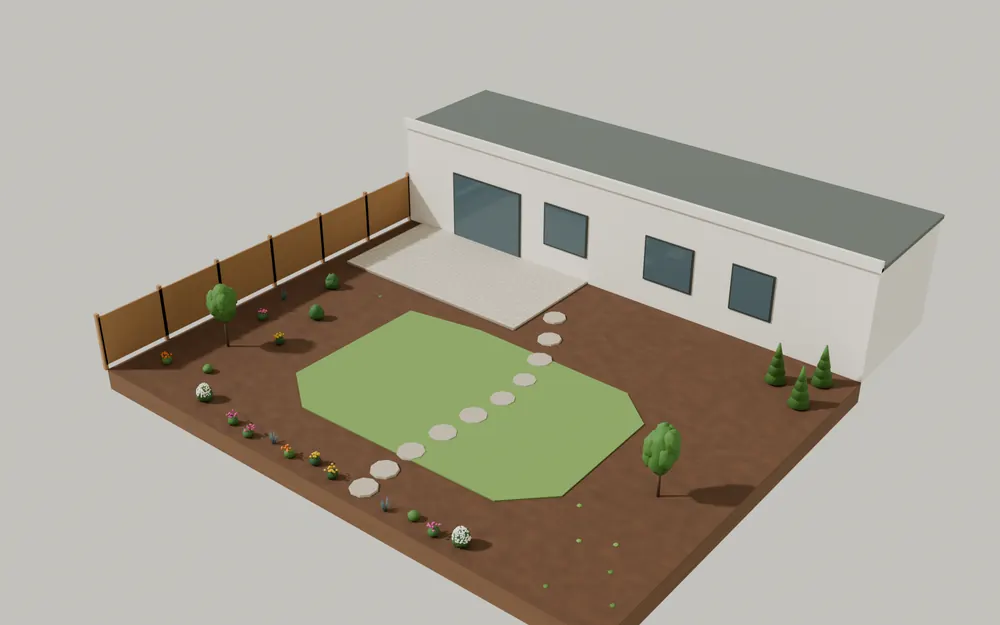
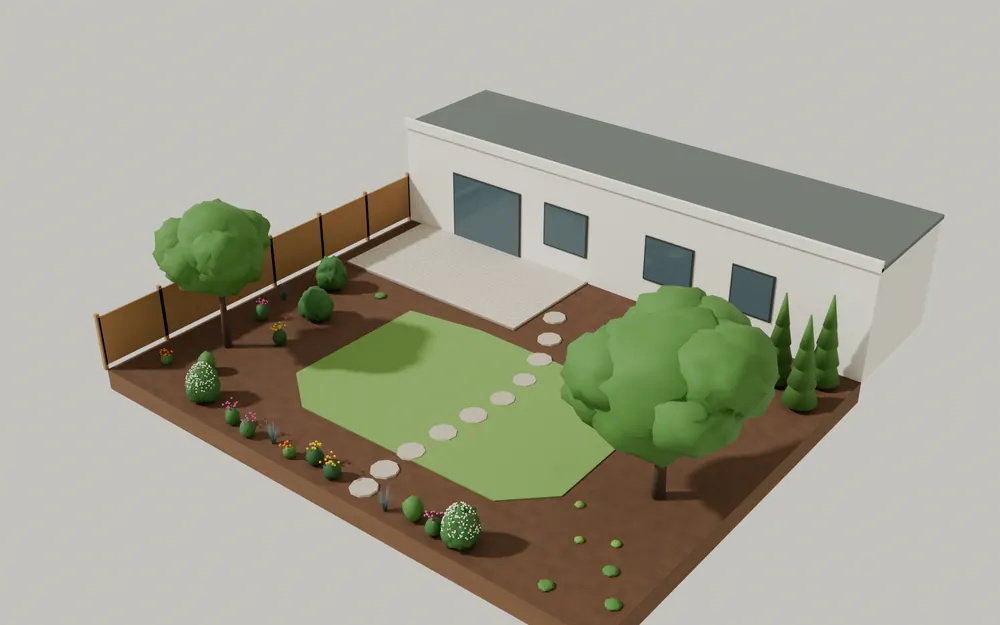
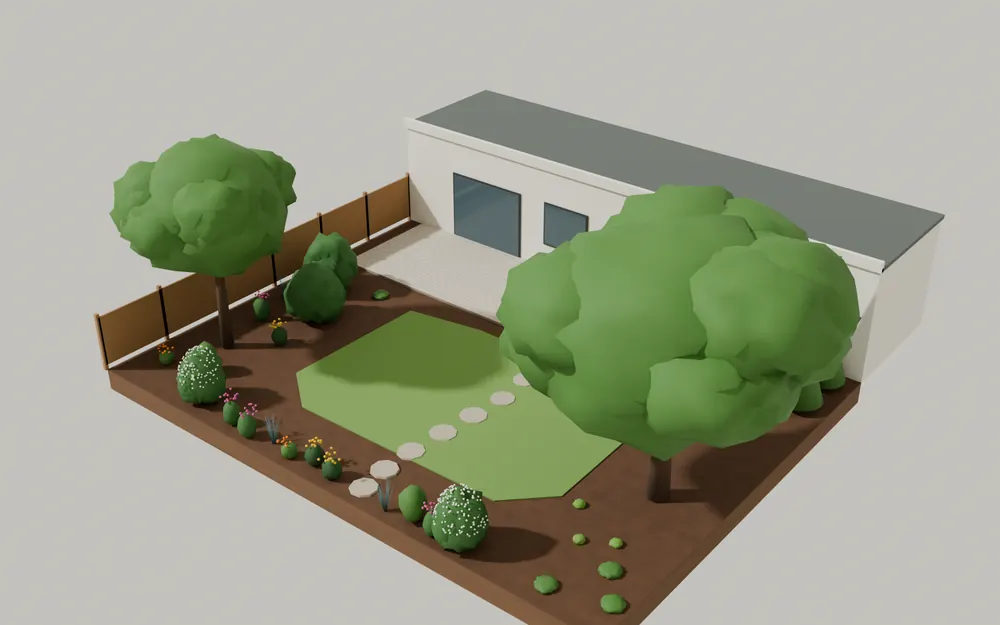
Blender renders of the same sample garden, built from the same plant data and growth rules. Illustrative — the planner’s own views are the plan and 3D shown above.
Questions
How accurate are the growth projections?
They are planning estimates from typical mature sizes and growth classes, not predictions for a particular site. Use them to compare options and spacing; expect real plants to vary.
Why does a plant reach full size so fast?
Fast growers approach their mature size within roughly a decade under the model. Mature size is the typical landscape size, which many plants reach long before their ultimate size in the wild.
Related
Start designing in your browser
OpenLandscape3D is free and open source. Draw the site, place regional plants, and scrub through seasons and years before anything goes in the ground.